Basics of Geometry
Click here for definitions of terms
Contents
Lines and Angles
Lines
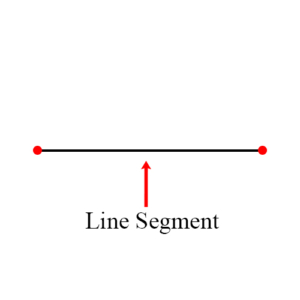
A line in geometry means a straight line, and it is actually infinite in both directions. A finite portion of a line between two endpoints is a line segment.
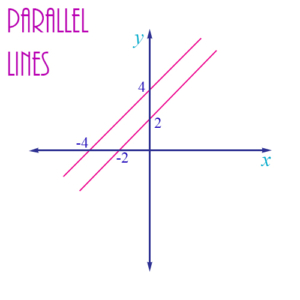
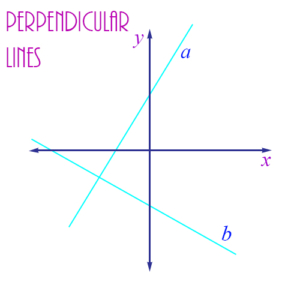
Two lines in the same plane are parallel if they never intersect. They are perpendicular if they intersect in a right angle.
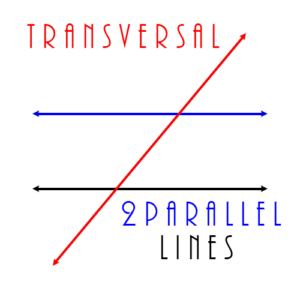
A line which intersects two other lines is a transversal. If the other two lines are parallel, then the transversal makes the same angle with both of them.
Angles
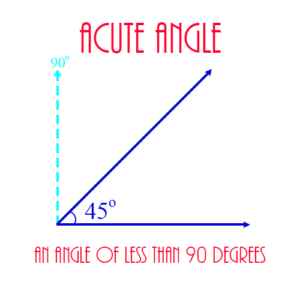
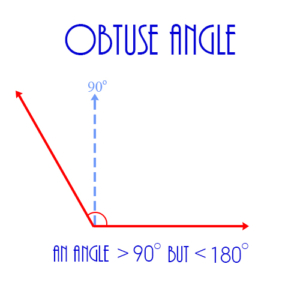
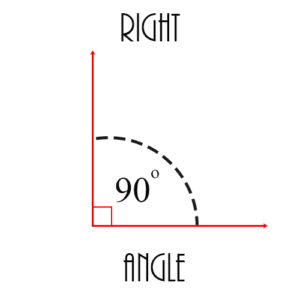
An angle of less than 90 degrees is acute. The figure shows an example, in this case the angle is 45°. An angle larger than 90 degrees but less than 180 degrees is obtuse. An angle of 90 degrees is called a right angle. It is exactly upright.
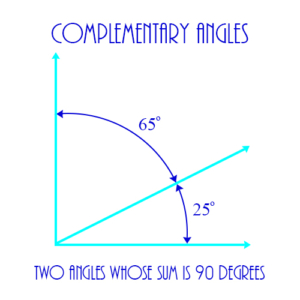
Two angles whose sum is 90 degrees are complementary.
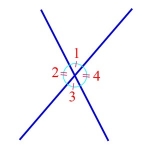
Two angles whose sum is 180 degrees are supplementary. In the figure angles 1 and 2 are supplementary, as are angles 1 and 4, 2 and 3, and 3 and 4. Vertical angles are two angles, for example, angles 1 and 3 in the figure, which are on opposite sides of the intersection of 2 lines.
Vertical angles are always equal to each other, because they are both supplementary to the same angle. For example, in the figure, angles 1 and 3 are vertical angles and are equal because they’re both supplementary to angle 2. Angles 2 and 4 are also vertical angles and are equal.
Polygons
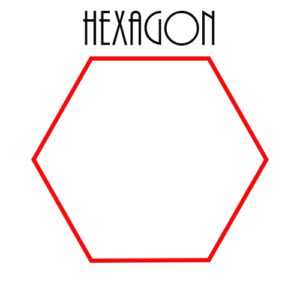
A polygon is a closed geometric figure consisting of connected line segments. If all its angles are less than 180°, then it is convex. Examples: Triangles, squares, rectangles, pentagons, hexagons. The figure shows an example of a hexagon.
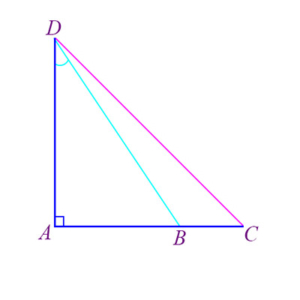
The point of intersection of two sides of a polygon is a vertex. In the figure the points A, D, and C are vertices of the larger triangle.
Triangles
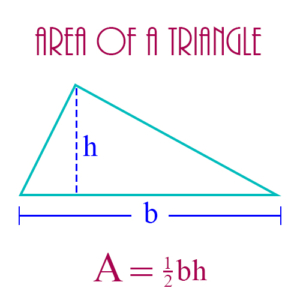
A triangle is a 3-sided polygon. Its altitude (or “height) is a line segment that extends from one vertex to the side opposite the vertex, called the base. The altitude is always perpendicular to the base. The figure shows the altitude of a triangle, designated as h, extending from the top vertex to the base, designated as b. If h is an altitude, and b is its corresponding base, then the area A of the triangle is calculated by A = ½bh.
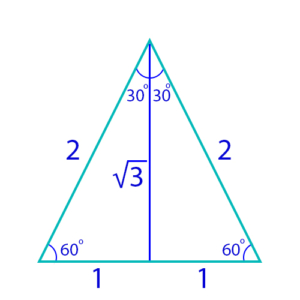
Congruent triangles are two triangles which are exactly equal in their corresponding sides and angles. The figure below shows two congruent triangles, one on the left, the other on the right, created by dividing an equilateral triangle in half. Note the equality of corresponding parts: Each triangle has a side of length 1 and a side of length 2. The vertical line in the middle is a side common to both triangles. Also, the three angles of both triangles are equal to each other: Each triangle has an angle of size 60° and an angle of 30°. Finally, the angle the vertical line makes with the base of the triangle is a right angle for each triangle, so these two triangles are congruent right triangles.
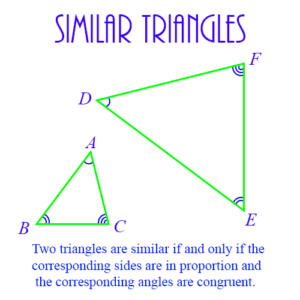
Two triangles are similar if their corresponding angles are equal to each other. Their corresponding sides are in the same ratio, but they aren’t necessarily equal. Therefore, congruent triangles are always similar, but similar triangles are not necessarily congruent – they can be, but they don’t have to be.
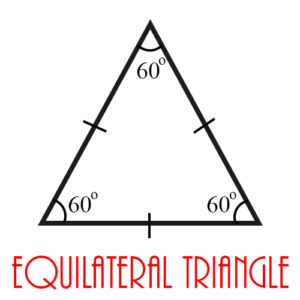
A triangle whose 3 sides have equal length is equilateral. Its 3 angles will also be equal in size, and so each angle in an equilateral triangle is 60° in size. Therefore, all equilateral triangles are similar, but they are not necessarily congruent.
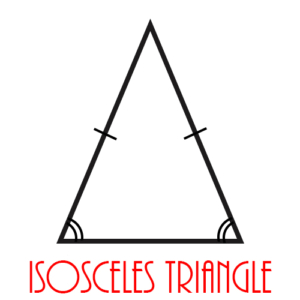
An isosceles triangle has two equal sides. The angles opposite these two equal sides are also equal. An isosceles triangle can be an acute, obtuse, or right triangle.
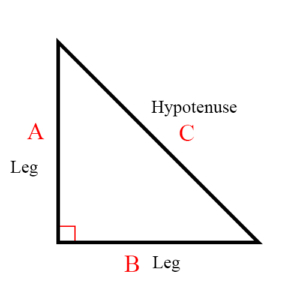
A right triangle is a triangle with a right angle. The legs of a right triangle are the two sides of the triangle whose intersection forms the right angle. The figure below shows a right triangle in which A and B are its legs. The hypotenuse is the side of a right triangle opposite the right angle – side C in the figure.
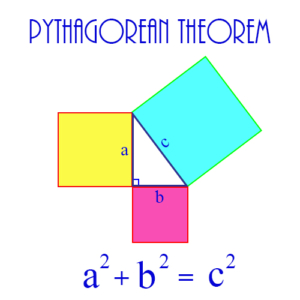
The Pythagorean Theorem is a mathematically proven statement that shows the relationship between the hypotenuse and the legs of a right triangle as a famous formula:
\(\begin{align}a^2 + b^2 = c^2\end{align}\)
where a and b are the lengths of the legs of the triangle, and c is the length of the hypotenuse.
Special Triangles: These triangles occur frequently in problems because of their “natural” structure.
30-60-90: This triangle is one-half of an equilateral triangle. As shown in the diagram below, a line from the apex of an equilateral triangle to the midpoint of the base results in two congruent right triangles. If each side of the equilateral triangle is of length 2, then the three sides of each half of the triangle have the lengths shown in the diagram.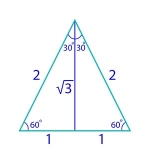
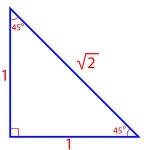
45-45-90: This triangle is an isosceles right triangle. If we assume that the legs of the triangle are each of length 1, then its 3 sides have lengths as shown in the diagram.
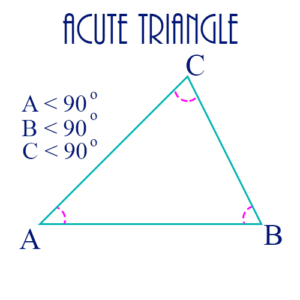
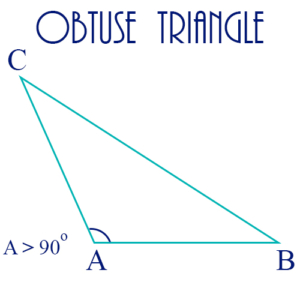
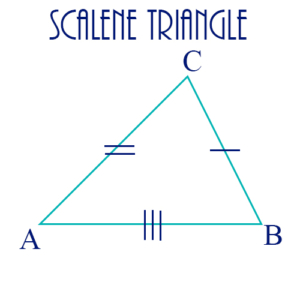
An acute triangle has 3 acute angles. An obtuse triangle has one obtuse angle. A scalene triangle has 3 unequal sides and therefore 3 unequal angles.
Quadrilaterals
A quadrilateral is a 4-sided polygon. Examples: Rectangle, square, parallelogram.
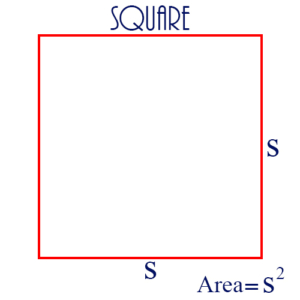
A square is a 4-sided figure with each side the same length and each angle a right angle. Its area is given by A = s².
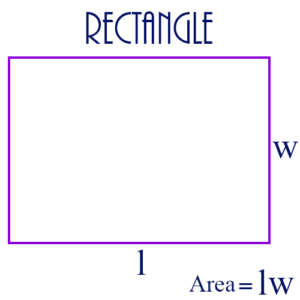
A rectangle is a 4-sided geometric figure with each angle a right angle. The area A of a rectangle is given by A = lw, where l is the length, and w the width of the rectangle.
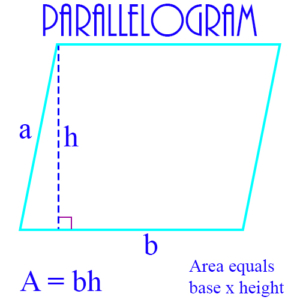
A parallelogram is a 4-sided geometric figure in which opposite sides are parallel. The height of the parallelogram is the length of a line segment drawn from one vertex perpendicular to an opposite side, called the base, as shown in the diagram. The area of the parallelogram is equal to the base × the height. That is, A = bh.
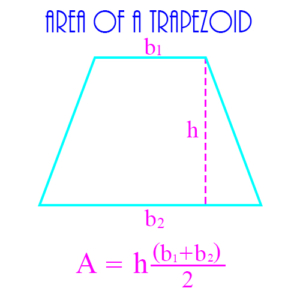
A trapezoid is a 4-sided figure with two opposite sides parallel, but whose other two opposite sides are not parallel. The figure shows a trapezoid together with the formula for its area.
Other Polygons
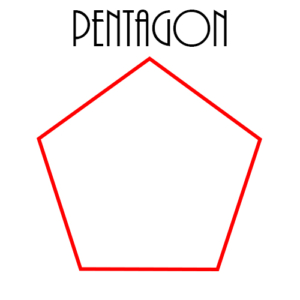
A 5-sided polygon is a pentagon. If all 5 sides are of equal length, then the pentagon is regular.
A 6-sided polygon is a hexagon. If all 6 sides are of equal length, then the hexagon is regular.
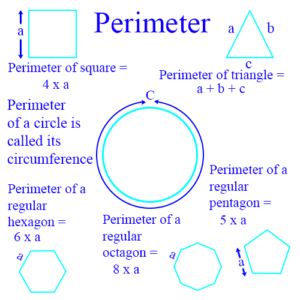
The distance around a geometric figure, usually a polygon, is its perimeter. (The perimeter of a circle is called its circumference.)
Example: The perimeter of a rectangle is the sum of the lengths of its 4 sides. If l is the length of the rectangle, and w is its width, then the perimeter p is calculated by p = 2l + 2w. The figure below shows perimeters of several polygons, as well as the perimeter or circumference of a circle.
Circles
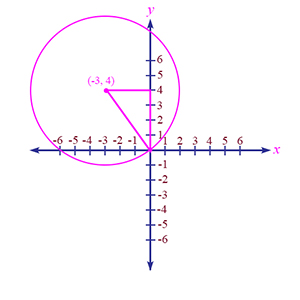
A circle is a set of points equidistant from a given point. The given point is the center of the circle, and the distance from the center to any point on the circle is the radius. The figure shows a circle of radius 5 on the coordinate plane, with its center at the point (-3, 4).
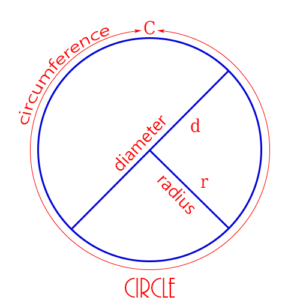
A line segment from one point on the circle to a point on the opposite side of the circle, passing through the center of the circle, is called a diameter. Its length is always twice the length of a radius.
The circumference (or the perimeter) is the distance around a circle. It is given by the formula:
\(\begin{align} C = \pi d\end{align}\)
where d is the diameter of the circle, and \(\begin{align}\pi\end{align}\) is a constant value approximately equal to 3.14.
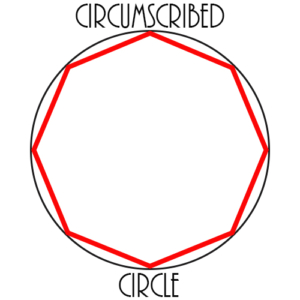
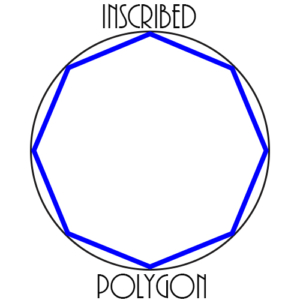
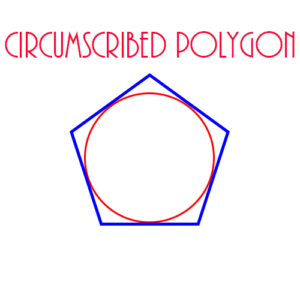
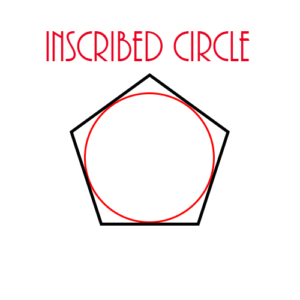
A circumscribed circle is a circle drawn around a polygon in such a way that all the vertices of the polygon are points on the circle. In this case the polygon is inscribed in the circle. The two figures on the left show 2 circles, each circumscribed around an octagon (8-sided polygon). Each of these figures is really the same figure – we’re just looking at them differently. In one case, we say the circle is circumscribed. In the other case, we say the polygon is inscribed. A circumscribed polygon is drawn around a circle in such a way that each side of the polygon is tangent to the circle. In this case, the circle is inscribed in the polygon, as shown in the two figures on the right.
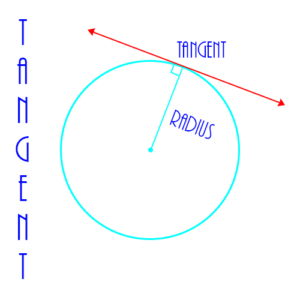
A tangent is a line which intersects or “touches on” a circle at exactly one point. The single point where they meet is called the point of tangency. In the figure the point of tangency is where the tangent line and the radius intersect.
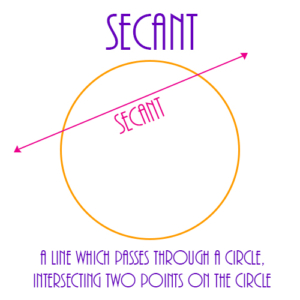
A secant is a line which passes through a circle, intersecting 2 points on the circle.
3-Dimensional Geometry
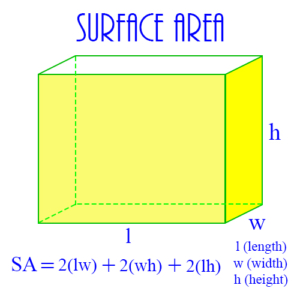
A rectangular solid is a 3-dimensional figure with 6 sides, all of which are rectangles. The figure shows an example, together with the formula for calculating its external area, called its surface area.
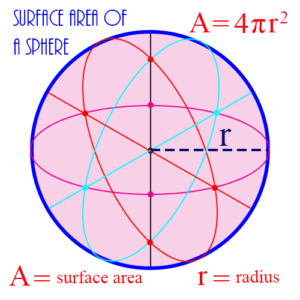
A sphere is a 3-dimensional figure consisting of a set of points, all of which are the same distance from a single, central point. The distance from the center point to any point on the sphere is the radius of the sphere. The figure shows a sphere of radius r, together with the formula for the surface area of the sphere.
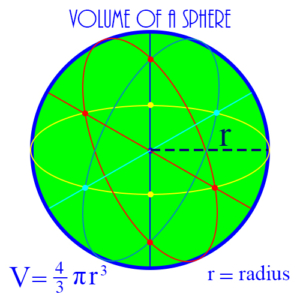
The measure of the interior capacity of a 3-dimensional geometric object is its volume. Example: The volume of a sphere is 4/3 πr³, where r is the radius of the sphere.
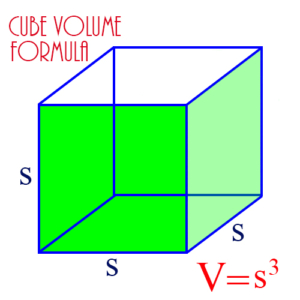
A cube is a 3-dimensional figure of 6 sides or faces, each of which is a square with the same dimensions. Each line where two faces meet is called an edge, and each edge has the same length. The cube’s volume is given by the formula:
\(\begin{align} V = s^3\end{align}\)
where s is the length of each edge of the cube.
A side of any 3-dimensional geometric object is called a face. These can be seen in the cube in the figure above, which also shows the cube’s edges. In the figure 3 edges are marked as s. As you can see, a cube has 12 edges altogether.
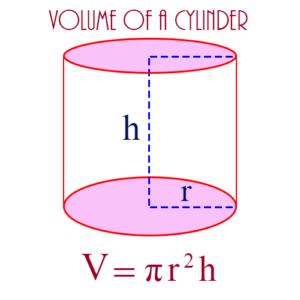
A cylinder is a 3-dimensional figure whose bottom and top bases are both circles. Starting at the bottom base it continues straight up to height h until it ends in the top base, which is a circle of the same radius as the base at the bottom. Its volume is given by the formula:
\(\begin{align} V = \pi r^2 h\end{align}\)
where r is the radius of either base, and h is the height of the cylinder.
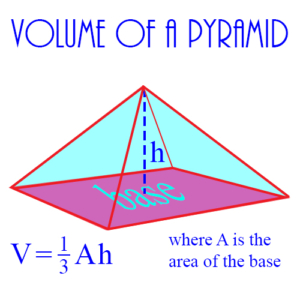
A pyramid is a 3-dimensional object, with a base which is usually a square or an equilateral triangle, and each vertex of which is connected via a straight line to an apex. The figure shows a pyramid with a rectangular base, as well as the formula for calculating its volume.
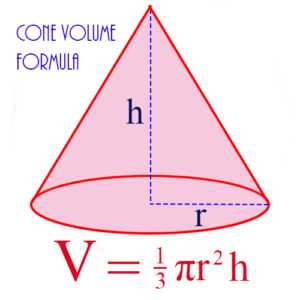
A cone is a 3-dimensional geometric figure whose base is a circle, and which moves up from the base until it converges to a single point, as shown in the figure below. Its volume is calculated from the formula:
\(\begin{align} V = \frac{1}{3} \pi r^2 h\end{align}\)
where r is the radius of the circle at the base, and h is the height from the base to the point at the top.
Coordinate Geometry
The Coordinate Plane
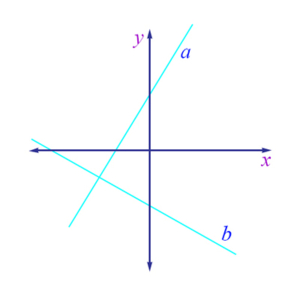
In coordinate geometry, the coordinate axes are two straight lines, one horizontal (the x-axis), and the other vertical (the y-axis), that define a plane (the coordinate plane) for graphing equations. Every real number is on each of these two axes, and the point – called the origin – at which the axes intersect is 0 on both axes. Moving to the right on the x-axis, the numbers increase, and moving to the left they decrease. Moving up on the y-axis, numbers increase, and moving down they decrease. Every point on the coordinate plane has an x-coordinate and a y-coordinate – two real numbers which define exactly where the point is on the plane. The figure shows the x and y axes with two lines, a and b.
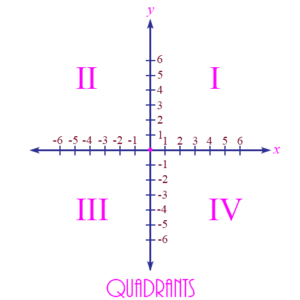
The four sections of the coordinate plane are called the quadrants. They are defined by the coordinate axes. The first quadrant is the upper right, the second is the upper left, the third is the lower left, and the fourth is the lower right. A point in any of the quadrants will have positive or negative coordinates as follows: Quadrant I: x positive, y positive; Quadrant II: x negative, y positive; Quadrant III: x negative, y negative; Quadrant IV: x positive, y negative. Points on the two axes do not lie in any quadrant.
The coordinates of a point are an ordered pair of real numbers (x, y) which identify the point’s location on the coordinate plane. The first number, called the x-coordinate, identifies where the point is along the x-axis, and the second number, the y-coordinate, identifies where the point is along the y-axis. For example, in the figure below the coordinates (-3, 4) identify the point which is 3 units to the left of the y-axis and 4 units above the x-axis. This point is the center of a circle of radius 5.
Other examples:
-
-
-
-
- (4, 3) is the point 4 units to the right on the x-axis, and 3 units up on the y-axis. It’s in the first quadrant.
- (-4, 3) is the point 4 units to the left on the x-axis, and 3 units up on the y-axis. It’s in the second quadrant.
- (-4, -3) is the point 4 units to the left on the x-axis, and 3 units down on the y-axis. It’s in the third quadrant.
- (4, -3) is the point 4 units to the right on the x-axis, and 3 units down on the y-axis. It’s in the fourth quadrant.
- (0, 0) is the origin. It is not in any quadrant, but is the point where the x and y axes intersect.
-
-
-
Lines
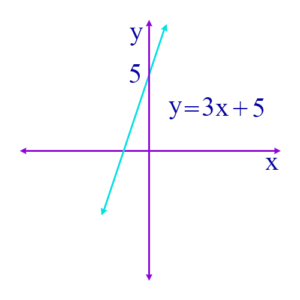
A line is a set of points on the coordinate plane that is defined by a linear equation with x and y as variables. Every pair of (x, y) points that satisfies the equation is on the line, and every pair that does not satisfy the equation is not on the line. An example of such an equation is
\(\begin{align}y = 3x + 5\end{align}\)
This equation defines a straight line which passes through the y axis at y = 5.
A linear equation is an equation with x, or x and y, as variables, but with every variable having an exponent of 1. Examples:
\(\begin{align}4x + 2 = 6\end{align}\)
\(\begin{align}5x – 3y = 17\end{align}\)
These equations are called “linear” because the graph of such an equation on the coordinate plane is a straight line.
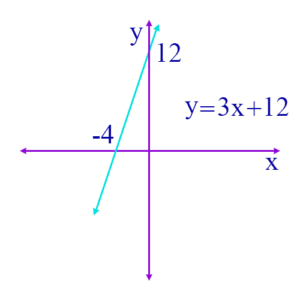
The intercepts are the points at which a line passes through the x- or the y-axis. At the y-intercept, the x coordinate for the point will be 0, and at the x-intercept the y coordinate will be 0. For example, in the equation, as shown in the figure:
\(\begin{align}y = 3x + 12\end{align}\)
the line passes through the y-axis at y = 12, and through the x-axis as x = -4. Thus, the y-intercept is 12 and the x-intercept is -4. Notice in the equation that when x is 0, then y is 12, and when y is 0, x is -4.
Slope
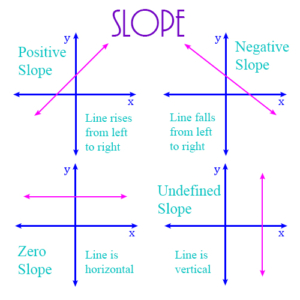
The slope of a line is the rate at which a line is rising or falling. If a line’s slope is positive, then the line is rising as it moves from left to right. If the slope is negative, then the line is falling as it moves from left to right. A simple example is:
\(\begin{align}y = 3x\end{align}\)
This line increases its y value by 3 every time its x value increases by 1. Thus, if x = 0, then y = 0. If x = 1, y = 3, etc. We say in this case that the slope of the line is 3.
For an opposite example, consider:
\(\begin{align}y = -3x\end{align}\)
On this line if x = 0, then y = 0, but if x = 1, then y = -3. So every time x increases by 1, y decreases by 3. So the slope of this line is -3. The figure below shows 4 possible values for a line’s slope: positive, negative, zero, or undefined.
The slope of a line is calculated by selecting two points on the line, taking the difference in their y coordinates, and dividing that by the difference in their x coordinates. For example, if (2, 4) and (3, 6) are two points on a line, then the slope of the line is
(6 – 4)/ (3 – 2) = 2/1 = 2.
If two lines are parallel, then they have the same slope. If they are perpendicular, then the slope of one of the lines is the negative reciprocal of the slope of the other.
To easily find the slope of a line, put the equation of the line in slope-intercept form. In this form, the line’s equation is expressed with y on the left of the equation and some expression in the variable x on the right. For example, suppose we take the equation of the line
\(\begin{align}2y – 6x = 12\end{align}\)
Then, solving for y in terms of x, we get
\(\begin{align}2y = 6x + 12\end{align}\)
\(\begin{align}y = 3x + 6\end{align}\)
This is the slope-intercept form. The slope of this line is the coefficient of the x term, and is therefore 3. The constant term, 6, is the y-intercept, because when x is 0, then y is 6.
If two lines are parallel, they have the same slope. Therefore, the two lines defined by these two equations are parallel:
\(\begin{align}y = 3x + 6\end{align}\)
\(\begin{align}y = 3x + 9\end{align}\)
Note that there are no values for x and y that satisfy both equations. That shows the two lines never intersect and are therefore parallel.
Two lines are perpendicular if their slopes are the negative reciprocal of each other. Look at these two linear equations:
\(\begin{align}y = 3x + 6\end{align}\)
\(\begin{align}y = -x/3 + 5\end{align}\)
These two lines are perpendicular because -1/3 is the negative reciprocal of 3, and vice versa. They intersect at the point having (x, y) coordinates that satisfy both equations. This point can be determined by solving these two equations as simultaneous linear equations.
Other Figures
A circle is a set of points equidistant from a given point. The given point is the center of the circle, and the distance from the center to any point on the circle is the radius. The figure shows a circle of radius 5 on the coordinate plane, with its center at the point (-3, 4). The equation for this circle is
\(\begin{align} (x + 3)^2 + (y – 4)^2 = 25\end{align}\)
In general, suppose you have a circle whose center is at the point (a, b), and which has radius r. Then the equation for this circle on the coordinate plane is
\(\begin{align} (x – a)^2 + (y – b)^2 = r^2\end{align}\)
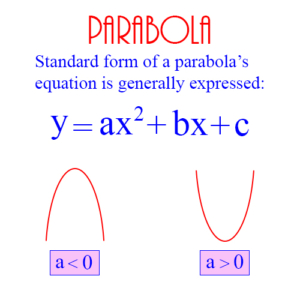
A parabola is a geometric figure which results by graphing a quadratic formula on the coordinate plane. The figure below shows the general form of the quadratic expression
\(\begin{align} y = ax^2 + bx + c\end{align}\)
which defines the parabola. Note that if a is less than 0 the parabola rises to a maximum point, whereas if a is positive the parabola goes down to a minimum point.
